

1. Introduction
2. Spectrum Setting for Monolithic Tandem Solar cells
2.1 Target spectrum
2.2 LED light source and its benefits
2.3 Top cell current limit and bottom cell current limit
3. Advancements in LIV Measurement Technologies
3.1 Influence of metastability
3.2 Suggested LIV measurement methods
4. Future Measurement Technologies for Mass Production
4.1 Demand for short measurement time
4.2 Strategies to reduce measurement time
4.3 Combined use of proposed methods
5. Summary
1. Introduction
Perovskite/silicon tandem solar cells are gaining attention as next-generation photovoltaic technology due to their potential to surpass the theoretical efficiency limit of single-junction silicon solar cells. By combining perovskite and silicon materials that absorb different wavelengths, tandem structures can achieve a power conversion efficiency (PCE) of approximately 35%1, 2). This is because perovskite absorbs visible light, while silicon absorbs infrared light, allowing a broader utilization of the solar spectrum3). However, to achieve theoretical efficiency in practical applications, precise spectral control tailored to the response characteristics of each material, along with accurate performance assessment methods, is essential.
In particular, for monolithic tandem solar cells, precisely setting the light spectrum that each sub-cell receives is critical to optimize performance. Sunlight undergoes absorption, reflection, and scattering as it passes through multiple encapsulating layers, such as glass covers, encapsulants, and back sheets, causing the spectrum to shift. These spectral shifts can hinder effective current matching between sub-cells, making accurate spectral management crucial. Recently, light-emitting diode (LED)-based solar simulators have become widely used for this purpose. LEDs offer greater flexibility in spectral tuning than traditional xenon or halogen lamps, allowing for precise matching to reference spectra, such as AM1.5G. This approach enables better control over the amount and wavelength of light reaching each sub-cell, achieving current matching. Additionally, LEDs’ high thermal stability and long lifespan make them suitable for large-scale testing, ensuring consistent data accuracy over time.
In addition, advancements in measurement technologies are necessary to meet the industrial demand for faster and more accurate assessment in mass production settings. Due to the metastable nature of perovskite4, 5), its current-voltage (I-V) characteristics can vary over time6), complicating accurate efficiency measurements due to phenomena like ion migration and hysteresis7, 8). To address these issues, innovative methods such as nonlinear I-V sweeps, dynamic I-V forecasting, and post-correction techniques have been introduced.
Nonlinear I-V sweep techniques dynamically adjust the voltage sweep rate based on the capacitive effects at each voltage point, enabling fast yet accurate measurements. The dynamic I-V forecasting technique is designed to significantly reduce measurement time by using partial data at each voltage point to predict stable current values without waiting for complete stabilization, thus producing reliable I-V curves efficiently14-17). Finally, post-correction methods process distortions in the I-V curve by averaging forward and reverse sweeps to provide consistent final data that minimizes residual hysteresis.
Combining these individual techniques is essential for accurately assessing the performance of perovskite/silicon tandem solar cells. For instance, the simultaneous application of nonlinear I-V sweep and dynamic I-V forecasting enables efficient data collection while managing capacitive effects and time-dependent changes, and post-correction further enhances accuracy by reducing residual distortions. This integrated approach meets both the high accuracy and time-efficiency demands of research and industrial environments, enhancing the potential for commercial applications.
In this report, we introduce the performance assessment of perovskite/silicon tandem solar cells by combining LED-based spectral tuning with integrated, advanced measurement techniques. Such an approach facilitates reliable data acquisition in research settings and rapid, accurate verification in large-scale production, supporting the commercial viability and success of next-generation solar cell technologies.
2. Spectrum Setting for Monolithic Tandem Solar cells
2.1 Target spectrum
Solar cells, which convert light into electricity, require a high degree of accuracy in targeting the appropriate spectrum for optimal performance. This accuracy becomes even more critical in the case of monolithic tandem solar cells, which demand a higher level of precision in dealing with the spectrum due to their layered structure and the need for efficient light management across different sub-cells. In a solar module, the spectrum of light that the cell receives is different from the spectrum of direct sunlight because it passes through several layers of materials, such as cover glass and encapsulants, before reaching the cell. These materials modify the light in several ways.
First, the cover glass, often made of low-iron glass to increase light transmission, can still absorb or reflect specific wavelengths of light. This means the light spectrum reaching the cell is altered as it passes through the glass. Next, encapsulant layers like ethylene-vinyl acetate (EVA) or polyvinyl butyral (PVB). These materials can also absorb specific wavelengths, particularly in the UV range, further modifying the light spectrum. Additionally, the back sheet of the module may reflect some of the light, causing the spectrum that reaches the cell to change through multiple reflections and scattering events9).
Since light passes through these layers, its intensity and spectrum are transformed due to absorption, reflection, and scattering, resulting in a modified light spectrum that the solar cell ultimately absorbs.
As a result, the light spectrum that arrives at the light absorbing layer doesn’t match the light spectrum AM1.5G. Accordingly, the target spectrum that is used for solar cell measurement needs to be matched to the light spectrum considering the factors mentioned above. The target spectrum should be designed so that the spectrum after passing through the air and the TCO layer is identical to the spectrum of the standard light source, AM1.5 global, after passing through the module components and the TCO layer. To do so, optical simulations at each layer to interpret and implement the spectrum change must be proceeded.
2.2 LED light source and its benefits
Recently, LED-based solar simulators have gained traction due to several advantages over traditional light sources like xenon or halogen lamps10). One key benefit is their spectral tunability, which allows precise control over the emitted light spectrum. This, enables a closer match to reference spectrum like AM1.5G (Since this report advocates the use of a specific target spectrum, it would be more accurate to refer to it as the target spectrum rather than AM 1.5G. However, for convenience, the term AM 1.5G will be used). This tunability is especially important for tandem solar cells, where each subcell is responsive to different parts of the light spectrum. Fig. 1 is a flowchart of the iterative calculation procedure to identify suitable LED settings to adjust the LED spectra for tandem device measurements. LEDs are also more energy-efficient compared to traditional light sources, requiring less power to produce the same light intensity. This makes them both environmentally friendly and cost-effective over time. Additionally, LEDs have a much longer lifespan and provide more stable light output, reducing the need for frequent recalibration and ensuring consistent measurements. LED-based simulators also allow for fine adjustments in light intensity, which is crucial for tuning the light conditions when measuring multijunction or tandem solar cells. This flexibility ensures that each subcell receives the appropriate amount of light for accurate I-V curve measurements.
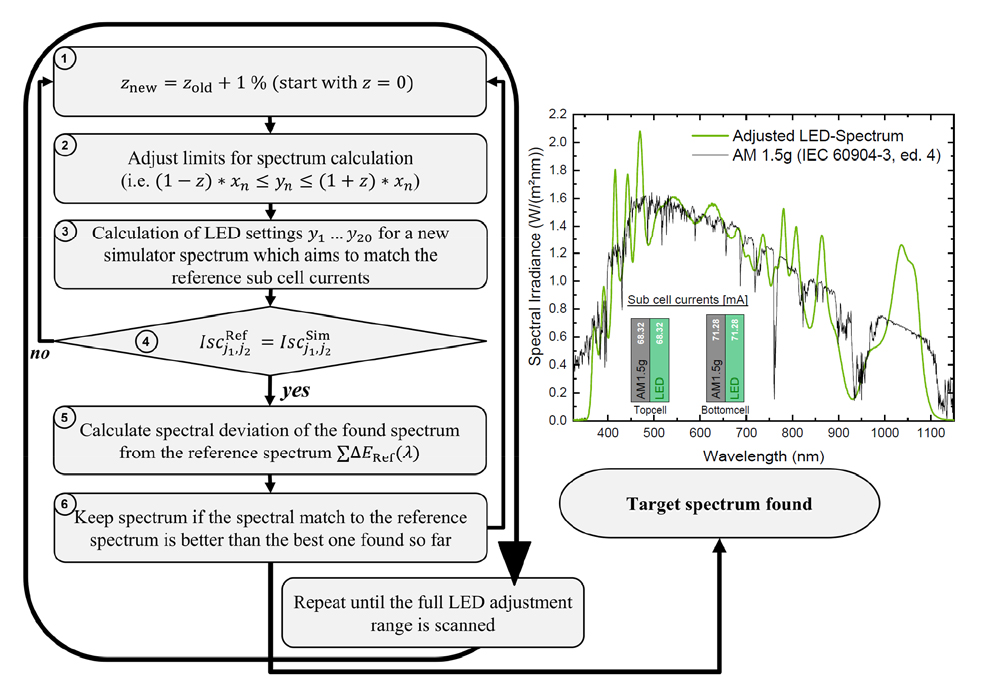
Fig. 1
Flowchart illustrating the iterative calculation procedure for determining optimal LED settings to adjust the LED spectra of a LED-based solar simulator for tandem solar cell measurements. The bar graphs within the target spectrum demonstrate the sub-cell currents under the calculated simulator spectrum (green bars) and under the AM1.5G reference spectrum (black bars)11)
Fig. 1 presents a flowchart illustrating the iterative calculation procedure to adjust the LED spectra in an LED-based solar simulator for accurate tandem solar cell measurements11). This procedure aims to ensure that both subcells in a tandem solar cell receive an appropriate spectrum so that their current generation matches the ratio observed under the AM1.5G reference spectrum. Unlike single-junction solar cells, tandem solar cells require precise spectral adjustments to simulate realistic operating conditions. LED-based solar simulators, which consist of multiple spectrally distinct light sources, must generate an optimized spectrum that satisfies both the subcell current matching condition and spectral similarity to AM1.5G.
The process begins with an initial approximation of the LED spectrum to closely resemble the AM1.5G spectrum. This is achieved by adjusting the intensities of multiple LED light sources to minimize spectral difference (SPD) and maximize spectral coverage (SPC). However, this initial approximation alone is often insufficient for achieving an exact subcell current match, necessitating further adjustments.
To obtain the desired current matching, an iterative adjustment method is employed. In each iteration, small deviations from the initial LED settings are introduced to systematically optimize the spectrum. A variable z gradually increases, expanding the permissible variation range of LED intensities. The adjusted spectra are then evaluated based on whether the current ratio between the top and bottom subcells aligns with the reference AM1.5G conditions. If the target current ratio is not achieved, further modifications to LED intensities are applied, and the process continues iteratively.
Throughout this iterative adjustment process, the individual spectral characteristics of each LED light source and the spectral response (SR) of the solar cell are considered to fine-tune the subcell currents. The method proposed in the paper formulates spectral adjustment as a nonlinear optimization problem, where LED intensities are modified to satisfy the subcell current conditions. Instead of measuring each LED spectrum independently, the approach involves systematically varying the intensity of each LED while maintaining the overall LED spectrum. This method compensates for thermal effects and ensures accurate spectral adjustments.
This iterative process continues until an optimal target spectrum is identified—one that meets the subcell current ratio requirement while closely resembling the AM1.5G spectrum. This ensures that tandem solar cells are measured under the most accurate conditions, allowing for precise and reliable performance evaluations. The proposed spectral adjustment method has been validated through comparison with a calibrated 3-source solar simulator at Fraunhofer ISE, demonstrating strong agreement and confirming the applicability of LED-based solar simulators for tandem solar cell characterization.
2.3 Top cell current limit and bottom cell current limit
In monolithic tandem solar cells, the overall current is limited by the subcell that generates the lowest current, as both subcells are connected in series. This results in two possible limiting scenarios: the top and bottom limits. When the top cell, typically made of perovskite, limits the current, it occurs under a spectrum weighed toward longer wavelengths (red-shifted), meaning that the top cell receives less of the shorter-wavelength light that it absorbs most efficiently. In this case, the top cell cannot generate as much current as the bottom cell, thus, the total current of the tandem device is constrained by the top cell’s output. This is reflected in the current-voltage (J-V) curve by reducing short-circuit current (JSC), as the top cell cannot produce additional current. While the open-circuit voltage (VOC) and fill factor (FF) may remain relatively stable, the overall performance decreases due to the top cell’s current limitation12). On the other hand, when the bottom cell, typically made of silicon, limits the current, it occurs under a spectrum that is rich in shorter wavelengths (blue-shifted), meaning that the bottom cell receives less of the longer-wavelength light (such as infrared) that it absorbs most efficiently. In this scenario, the bottom cell cannot generate as much current as the top cell, and the bottom cell’s performance limits the total device current. This is also seen in the JV curve as a lower JSC due to the limitations of the bottom cell. However, when the bottom cell limits the current, the fill factor (FF) can increase as recombination losses are reduced, partially compensating for the current limitation12). In both cases, the subcell that limits the current affects the overall performance of the tandem solar cell, which is primarily seen as a reduction in JSC on the JV curve. While VOC and FF are less impacted, optimizing the balance between the performance of the top and bottom subcells is essential for maximizing the efficiency of the device.
Fig. 2 shows these features. For further verification during production, adjusting the z-value intentionally can help monitor whether the top or bottom cell is limiting the current, ensuring that the cells are performing according to design expectations. This helps verify that the cell is manufactured correctly and operates efficiently under intended conditions. For this reason, the use of a target spectrum with an LED light source helps verify whether the tandem cell is limited to the top or bottom cell.
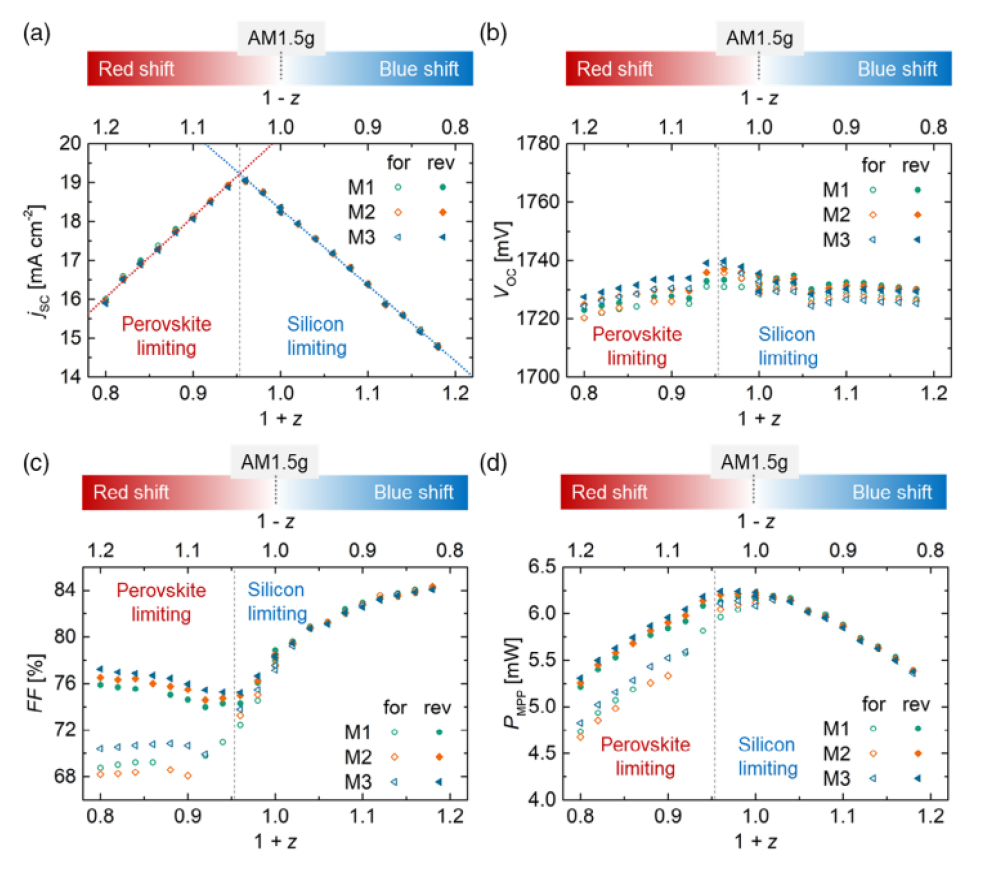
Fig. 2
Results of spectrometric characterization. Three measurements were taken alternately in forward (for) and reverse (rev) scan directions, referred to as M1, M2, and M3. a) JSC shows that the spectrum needs to be redshifted compared to the AM1.5G spectrum to reach the current match. Thus, at the AM1.5G spectrum (1 + z = 1 - z = 1.0), the silicon solar cell limits the current. Dashed red and blue lines represent linear fits to determine the current matching point. Dashed gray lines represent the current matching point in all graphs. b) There is no strong dependence on the voltage on the spectrum. c) FF in reverse scan shows a minimum at the current matching point. A clear hysteresis effect can be seen when the perovskite solar cell limits the current, which vanishes for blue-shifted spectra as the silicon solar cell becomes current-limiting. d) PMPP shows a flattened maximum as the decrease in JSC for a slight limitation of the silicon solar cell is compensated by the FF increase12)
3. Advancements in LIV Measurement Technologies
3.1 Influence of metastability
Perovskite materials exhibit metastability, meaning their properties can change temporarily due to external factors such as light, electric fields, and environmental conditions. This metastability directly impacts on light current-voltage (LIV) measurements, often complicating the process of accurately characterizing the performance of perovskite-based solar cells. One of the main effects of metastability is ion migration, which occurs when ions within the perovskite material, such as halides or lead vacancies, move under the influence of an electric field during the LIV measurement. This ion movement alters the internal electric fields within the solar cell, affecting charge transport and recombination rates. As a result, J-V characteristics of the cell can change dynamically during the measurement, leading to inconsistent results. Another major issue is hysteresis in the J-V curves, where the current output of the solar cell depends on the scan direction of the voltage. This hysteresis is closely linked to the metastable nature of perovskite materials, particularly ion migration and defect state trapping. During a forward scan (from short circuit to open circuit), the cell may show a different current response than during a reverse scan (from open circuit to short circuit), complicating the interpretation of the results. This behavior is particularly problematic when extracting key performance metrics such as JSC, VOC, FF, and PCE. Metastability is also associated with photo-induced changes, where the properties of the perovskite layer evolve under continuous illumination. For instance, light exposure can alter the carrier concentration within the material, temporarily improving or degrading the performance. This effect, known as photodoping, can cause the current output to change during the LIV measurement, leading to results that do not reflect the cell's true steady-state performance. Additionally, the light-soaking effect can occur, where the performance of the perovskite solar cells (PSCs) improves over time under illumination. This temporary enhancement can distort the LIV measurements if the cell is not adequately stabilized beforehand. The environmental sensitivity of perovskite materials also plays a role in their metastability. Exposure to moisture or oxygen can induce changes in the material, leading to degradation during the measurement process. Even slight degradation can alter the charge transport and recombination properties of the cell, introducing variability in the JV curve and making it difficult to obtain reproducible results. Because of these metastable behaviors, the LIV measurements of PSCs can exhibit artifacts, such as fluctuations in current or voltage, that are not representative of the cell's actual performance. These artifacts, caused by temporary changes in the material properties, make it challenging to determine the actual PCE of the cell. Without careful control and understanding of these metastable effects, the measured efficiency can be inaccurately high or low depending on the cell’s transient behavior during measurement.
3.2 Suggested LIV measurement methods
3.2.1 Maximum power point tracking (MPPT)
One of the most reliable methods for performance evaluation is MPPT, as described by Rakocevic et al. MPPT continuously adjusts voltage and current under steady illumination to track the device’s maximum power output. This approach is more stable and reflective of real-world conditions compared to J-V sweeps, as it can account for the transient behavior of PSCs by dynamically finding the actual power point, minimizing errors caused by hysteresis13). MPPT has been widely recognized as a key tool to ensure the reliable performance comparison of PSCs with varying architectures and transient responses13, 14).
In particular, as Saito et al. found, the standard perturb&observe (P&O) algorithm often causes significant oscillations in maximum power (Pmax) for slow-responding PSCs due to differences in current measured immediately after voltage increases versus decreases. To mitigate these oscillations, Saito et al. developed an algorithm that only compares power at voltages adjusted in the same direction, stabilizing the power measurements. Fig. 3 represents the developed MPPT algorithm.
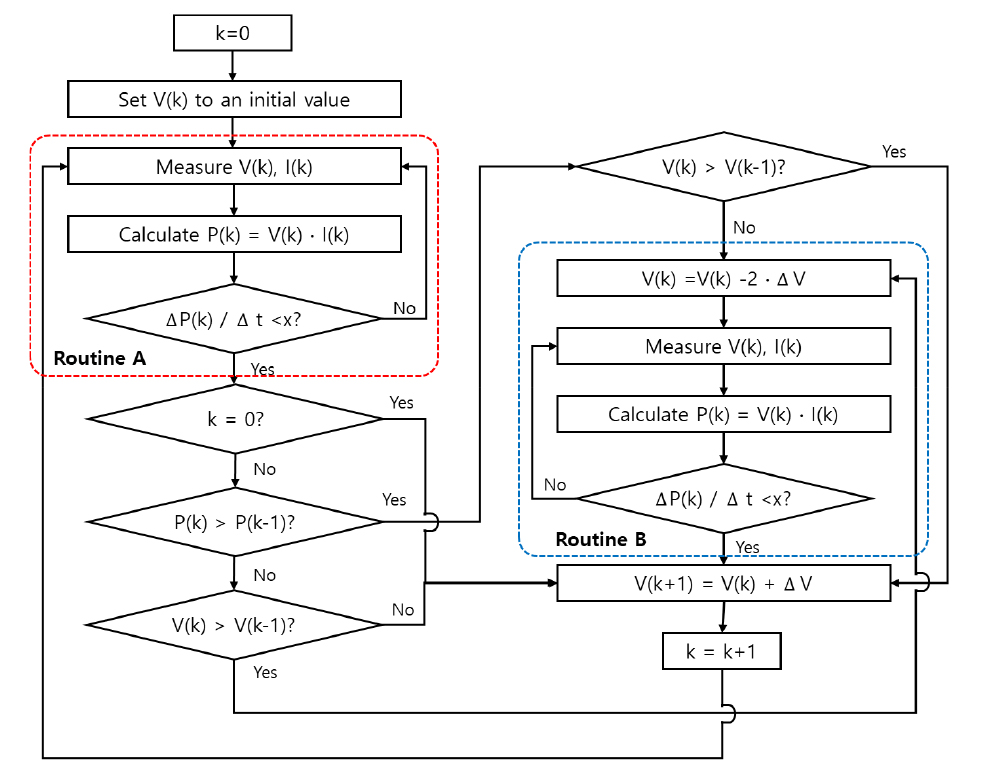
Fig. 3
Flow chart of MPPT algorithm developed from perturb & observe to prevent oscillation of voltage and power15)
Implementing this logic algorithm to assess data stabilization in the observation phase after each perturbation or using this oscillation-correcting approach can improve accuracy and reliability in MPPT for metastable PSCs15).
3.2.2 Dynamic J-V Sweep
Dynamic J-V sweep, as suggested by Bardizza et al. and Sanchez et al., involves holding the device at each voltage step until the current stabilizes, allowing for more accurate data compared to fast J-V sweeps, which often introduce errors due to hysteresis.
Fig. 4 shows the flow chart of the dynamic J-V sweep algorithm. This method ensures that transient effects, such as those related to ion migration and charge recombination, do not distort the measurement14, 16).
Christians et al. also highlight the importance of considering scan rate and direction, as hysteresis highly depends on these variables17).
3.2.3 Asymptotic I-V scan (Reduced IV span)
The asymptotic I-V scan, a steady-state measurement method, is particularly suited for PSCs and other emerging photovoltaic technologies that exhibit dynamic responses under illumination.
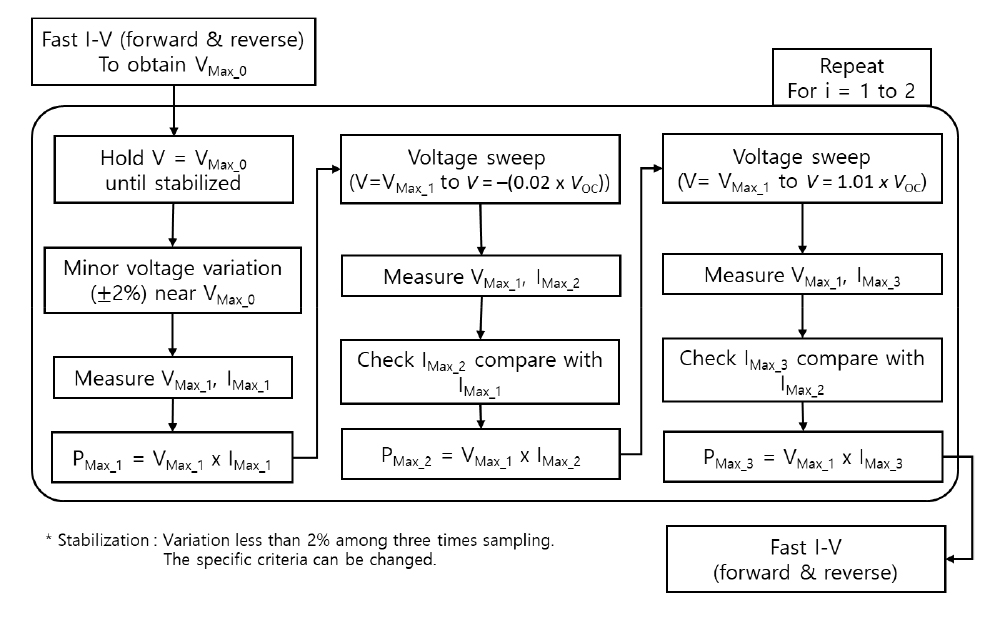
Fig. 5 shows the flowchart of the Asymptotic I-V Scan suggested. This method involves selecting a narrow voltage window centered around the device’s maximum power point (Vmax) and holding the device at each voltage step within this range until the current stabilizes, effectively reaching a steady-state condition. Unlike traditional slow-scan J-V measurements, which often suffer from transient effects and hysteresis, the asymptotic I-V scan provides a more reliable measure of maximum power by mitigating these effects. The stability criterion is defined by observing the relative current change rate within a specified time window.
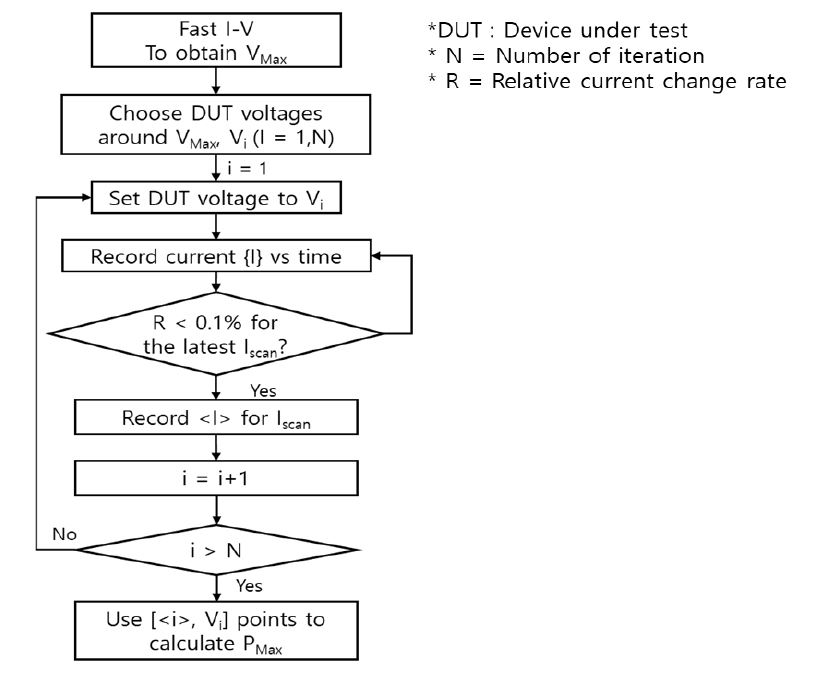
For example, a threshold of 0.1% change per minute is commonly used to accurately represent the steady-state maximum power. By holding the device at each voltage step until the current stabilizes within this threshold, researchers can obtain data that reflect actual steady-state performance, thus providing more consistent and comparable efficiency measurements across different cell types and architectures. This method has yielded performance metrics that align closely with real-world conditions, offering a stable and reproducible approach for characterizing perovskite and other emerging photovoltaic (PV) technologies. The asymptotic I-V scan is therefore highly recommended for performance calibration, especially in cases where conventional J-V sweeps fail to capture the long-term operational behavior of the device18).
3.2.4 Device preconditioning and environmental controls
Another critical aspect of improving measurement accuracy is device preconditioning. Dunbar et al. showed that preconditioning treatments, such as light soaking, are crucial for ensuring the device reaches a steady state before measurement. Without proper preconditioning, transient effects caused by voltage bias and illumination changes can significantly alter the results19, 20). Khenkin et al. further emphasize the need for standardized protocols like ISOS (International Summit on Organic PV stability) to account for environmental factors such as humidity, temperature, and UV exposure, which greatly influence the stability and accuracy of measurements21).
3.2.5 Stability and long-term performance
Finally, Zimmermann et al. and Dunbar et al. note that for PSCs to move toward commercialization, measurement methods should be refined, and stability under real-world conditions must also be considered. Long-term stability issues, such as moisture or UV exposure degradation, must be addressed through robust evaluation protocols22, 23). To this end, Fell et al. advocate for updates to international standards like IEC 60904 to include guidelines for measuring metastable devices such as PSCs20).
4. Future Measurement Technologies for Mass Production
4.1 Demand for short measurement time
The demand for shorter measurement times in perovskite/silicon tandem solar cells is driven by several factors critical to research and industrial applications. First, as PSCs exhibit metastable behavior—such as ion migration and hysteresis—lengthy measurement times can introduce inaccuracies due to time-dependent changes in the material properties under illumination or voltage bias. Metastability can lead to temporary fluctuations in the device’s performance, affecting J-V characteristics and overall efficiency calculations21). Additionally, PSCs are highly sensitive to environmental factors like humidity and temperature20, 21), which can degrade the material over time. Prolonged exposure during measurement can, therefore, compromise the integrity of the cell, leading to results that do not accurately reflect its true operational capabilities. Moreover, in an industrial context, shorter measurement times are essential for the scalability and commercialization of tandem cells. Rapid and efficient testing is necessary to evaluate large volumes of devices, particularly in mass production settings, where delays in the evaluation process can bottleneck overall production. Lastly, the development and commercialization of these technologies rely on consistent and reproducible performance metrics. Shortening the measurement time reduces the potential for environmental or operational factors to skew results, ensuring that efficiency and stability are measured under more controlled and relevant conditions19).
4.2 Strategies to reduce measurement time
4.2.1 Nonlinear IV sweep
In Xu’s work24), the proposed hysteresis compensation algorithm is designed to optimize the voltage sweep rate, especially in regions where capacitance effects are most significant, such as around the maximum power point. The algorithm generates a nonlinear voltage sweep that slows the sweep near the maximum power point (MPP) (where hysteresis is most prominent due to the higher capacitance) and speeds it up in regions with lower capacitance. This redistribution of measurement time reduces hysteresis errors without significantly prolonging the total measurement time. The algorithm reduced the hysteresis error in maximum power from around 1.46% to just 0.38% in high-capacitance modules, which is a substantial improvement. This approach, which dynamically adjusts the sweep speed according to the capacitance, effectively minimizes parasitic currents that distort measurements during fast voltage sweeps. Given that perovskite/silicon tandem cells also exhibit high capacitance and dynamic charge behavior, this method holds promise for addressing hysteresis in tandem cells as well. Perovskite layers are known to suffer from hysteresis due to ion migration and slow charge transport, making an approach that accounts for capacitance variations highly relevant. This method can be easily applied to the measurement of perovskite/silicon tandem cells as it does not require any special algorithm or predictive model.
4.2.2 Dynamic I-V forecasting25)
Dynamic I-V forecasting is an advanced measurement technique designed to address the challenges posed by high-capacitance PV devices, such as PSCs. In conventional I-V measurements, particularly for devices prone to capacitance-related effects, the current is required to fully stabilize at each voltage point to obtain accurate data. This process can be time-consuming, especially for devices like PSCs that exhibit hysteresis. Dynamic I-V forecasting offers a solution by predicting the stabilized current response based on partially relaxed data, thereby reducing the overall measurement time while maintaining accuracy. The method relies on dynamic load profiling, which adjusts the hold time for each voltage point in proportion to the device’s capacitance. Instead of waiting for full stabilization, this technique collects a subset of the I-V data and, through predictive algorithms—such as high-order polynomials or cubic splines—models the expected steady-state I-V behavior. This approach allows for the generation of accurate I-V curves in a significantly shorter time compared to traditional methods, with typical deviations from steady-state measurements being less than 0.2%. PSCs are particularly susceptible to hysteresis due to ion migration, charge trapping, and capacitive effects, which result in discrepancies between forward and reverse voltage sweeps. These transient effects lead to performance metrics, such as short-circuit current (Jsc), open-circuit voltage (VOC), and maximum power point (MPP), varying depending on the scan direction and speed. As a result, accurate characterization of perovskite cells often requires slow voltage sweeps or steady-state measurements, both of which are time-consuming. Dynamic I-V forecasting offers a more efficient alternative for addressing these challenges. By predicting stabilized current response based on early I-V data, the method reduces the need for long stabilization times at each voltage point. This is particularly advantageous for hysteresis-prone devices like PSCs, where long waiting times are typically needed to mitigate hysteresis effects. By dynamically adjusting the measurement process in accordance with the device’s capacitance, dynamic I-V forecasting helps to minimize the impact of hysteresis while significantly reducing the measurement time. Moreover, the predictive modeling aspect of dynamic I-V forecasting allows for the reduction of hysteresis-induced errors. The technique generates I-V curves that closely approximate the device’s steady-state behavior, even when the measurement process is accelerated. This provides a more accurate representation of the true performance of the PSC without the need for slow or steady-state measurements. Consequently, the method helps to mitigate the influence of transient effects like hysteresis, improving the reliability of the performance evaluation. However, it is important to note that an accurate predictive model that reflects the specific characteristics of perovskite/silicon tandem cells is required. This method primarily serves as a measurement optimization technique and effectively manage hysteresis during I-V measurements by modeling the device’s dynamic behavior. In conclusion, dynamic I-V forecasting offers a practical and efficient approach for mitigating the effects of hysteresis in PSCs. By leveraging predictive algorithms to model the I-V response based on partially relaxed data, the method reduces measurement time. It minimizes hysteresis-related errors, making it a valuable tool for research and industrial applications. While it does not address the fundamental causes of hysteresis, it significantly enhances the accuracy and speed of performance evaluations, particularly for high-capacitance devices such as perovskite/silicon tandem cells. To utilize the dynamic I-V forecasting method, a predictive model must be developed for perovskite/silicon tandem cells. Fig. 6 is an example of predicting the steady-state I-V characteristics. While the referenced paper describes the method assuming only the high capacitance of silicon modules, perovskite/silicon tandem cells require consideration of additional factors, such as ion migration, to accurately predict the steady-state. Since ion migration occurs more slowly compared to capacitance charging, relatively longer actual measurement times may be required.
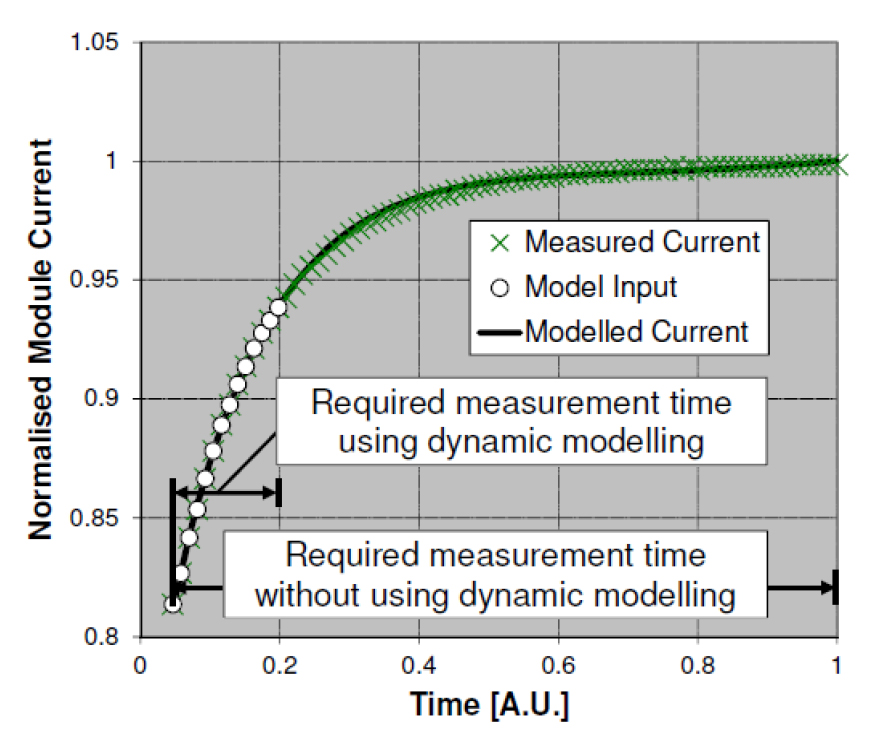
Fig. 6
Example application of the dynamic I-V algorithm for predicting the steady-state I-V characteristics25)
4.2.3 Post-Correction techniques26)
Post-correction methods, while not ideal for overcoming hysteresis entirely, offer significant advantages in terms of time efficiency. This technique works by averaging forward and reverse voltage sweeps to produce a quasi-static current, which helps to correct the distortions caused by hysteresis in I-V measurements. Though post-correction does not address the root cause of hysteresis, such as ion migration or charge trapping, it can reduce measurement errors and provide more reliable efficiency calculations. The limitations of this approach lie in its inability to resolve the fundamental issues causing hysteresis. The transient nature of perovskite materials, especially in perovskite/silicon tandem cells, means that simply averaging forward and reverse scans may not fully capture the dynamic behavior of the device. As a result, post-correction methods may not always accurately reflect long-term performance or give precise PCE values, particularly when dealing with devices where hysteresis is severe. However, the primary strength of post-correction methods lies in their speed. Compared to more time-consuming approaches like dynamic J-V sweeps or slow scan rate methods, post-correction is much faster and requires less data acquisition time. This makes it highly suitable for applications where rapid measurement is necessary, such as in industrial production environments or large-scale testing of many devices. While other techniques may offer more comprehensive insights into hysteresis behavior, post-correction remains one of the quickest ways to adjust for distortions in I-V curves without significantly increasing the total measurement time. In summary, post-correction methods offer a practical solution for reducing hysteresis-induced distortions in perovskite/silicon tandem solar cells, particularly when time efficiency is critical. Despite their limitations in fully resolving hysteresis effects, they provide a valuable trade-off between speed and accuracy, making them an attractive option for rapid testing and evaluation.
4.3 Combined use of proposed methods
Integrating nonlinear I-V sweep, dynamic I-V forecasting, and post-correction techniques into a unified measurement process provides an efficient and accurate approach to handle hysteresis effects, particularly in perovskite/silicon tandem cells. These methods, when combined, create a powerful strategy to optimize both measurement time and accuracy, ensuring reliable performance evaluations of high-capacitance devices.
4.3.1 Combined approach of nonlinear I-V sweep and dynamic I-V forecasting
Fig. 7 represents the example of combined method that will be explained further. In this integrated approach, nonlinear I-V sweep and dynamic I-V forecasting are applied simultaneously during the I-V measurement process to leverage the strengths of both methods. The nonlinear I-V sweep adjusts the voltage sweep rate based on the device’s capacitance. In regions with high capacitance, such as around the MPP, where hysteresis effects are most prominent, the sweep slows down for more accurate data collection. In contrast, it speeds up in regions with lower capacitance to reduce overall measurement time. At the same time, dynamic I-V forecasting uses partially stabilized data at each voltage point to predict the fully stabilized current. Predictive algorithms like high-order polynomials or splines model the expected steady-state current, bypassing the need for long stabilization waits at each point. This dual application allows accurate and efficient data collection by dynamically adjusting the sweep speed while quickly predicting stable current values.
4.3.2 Advantages of Simultaneous Application
The simultaneous use of nonlinear I-V sweep and dynamic I-V forecasting brings several key advantages. First, it reduces measurement time by allowing faster voltage sweeps in low-capacitance regions while ensuring accuracy in high-capacitance areas. Dynamic IV forecasting further speeds up the process by predicting current values, avoiding the need for long hold times at each voltage point. Second, this combined approach enhances accuracy. The nonlinear I-V sweep handles capacitance-related effects by adjusting the sweep speed where needed. At the same time, dynamic I-V forecasting ensures that even in rapid sweeps, the predicted current values are accurate, resulting in reliable IV curves that reflect the device’s actual performance. Finally, this approach helps to mitigate hysteresis. Hysteresis effects, caused by phenomena like ion migration and charge trapping, are minimized by the combination of slower sweeps in critical regions and the predictive power of dynamic forecasting, which accounts for the dynamic behaviors of the device. This ensures accurate performance measurements even in devices prone to significant hysteresis.
4.3.3 Final refinement with post-correction techniques
After the data collection with nonlinear I-V sweep and dynamic I-V forecasting, post-correction techniques are applied as a final step to refine the measurement results. This technique averages the forward and reverse voltage sweeps, compensating for any remaining hysteresis-induced distortions. While post-correction doesn’t address the fundamental causes of hysteresis, it smooths out discrepancies between the forward and reverse sweeps, providing a more reliable quasi-static current. By incorporating post-correction, any residual errors from the previous steps are minimized. This ensures the final data is as accurate as possible, even when dealing with devices where hysteresis effects persist despite optimized measurement techniques.
4.3.4 Unified Measurement Workflow
1. Start with Nonlinear I-V Sweep
Begin with a nonlinear sweep to optimize the measurement time by adjusting the sweep rate based on capacitance, focusing on critical regions such as MPP.
2. Simultaneous Dynamic I-V Forecasting
While sweeping, dynamically predict the stabilized current at each voltage point using partially relaxed data, reducing the need for long stabilization times.
3. Apply Post-Correction
After data collection, use post-correction techniques to average the forward and reverse sweeps, correcting for any remaining hysteresis-induced distortions and ensuring accurate performance metrics like PCE.
By combining nonlinear I-V sweep, dynamic I-V forecasting, and post-correction techniques, it becomes possible to achieve both fast and accurate measurements for hysteresis-prone devices like perovskite/silicon tandem cells. Nonlinear I-V sweep ensures efficient use of measurement time, dynamic I-V forecasting speeds up data acquisition without compromising accuracy, and post-correction refines the final results to minimize residual errors. This unified approach strikes an optimal balance between speed and accuracy, making it ideal for both research settings where detailed characterization is required and industrial applications that demand rapid and reliable performance evaluations.
5. Summary
Perovskite/silicon tandem solar cells hold significant potential to exceed the efficiency limits of traditional silicon cells, positioning them as a leading candidate for next-generation photovoltaic solutions. However, achieving reliable and accurate performance assessments for these cells remains challenging due to their unique sensitivity to spectral distribution, hysteresis, and metastable behavior. This report addresses these issues and emphasizes the importance of precise spectral management using LED-based simulators and advanced measurement methods. The proposed combination of nonlinear I-V sweeps, dynamic I-V forecasting, and post-correction techniques allows for accurate and efficient assessments. Nonlinear I-V sweeps and dynamic I-V forecasting work together to handle transient effects and capacitance-related challenges while reducing measurement time, which is critical in industrial settings. Post-correction techniques serve to refine these measurements, minimizing distortions from residual hysteresis. Together, these methods represent a robust approach to accurately characterizing perovskite/silicon tandem cells, providing consistency and speed for large-scale production. This report demonstrates that integrating spectral adjustment and comprehensive measurement methodologies can significantly improve the reliability of performance evaluations. Such advancements are essential for the commercial scalability of tandem solar technologies, ensuring that they meet the growing demand for efficient, sustainable energy solutions worldwide.
